After analysis, the results must be reviewed and interpreted. This process enables researchers to understand what the results mean and prepares them for communicating those results to others. This process can be broken into four steps: description and analysis, interpretation, judgment, and recommendation.
Description and Analysis
This step involves looking at the results of the data analysis and organizing the results so that the audience understands the data and can detect patterns. This data analysis should be described in a simple, straightforward fashion no matter how complex the data or analysis.
Aiming for simplicity does not mean that only one perspective can be presented. Rather, presenting different perspectives on the data can help create a balanced analysis.
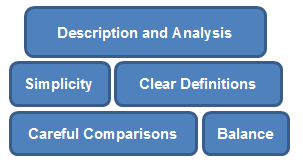
To help an audience understand results, clear definitions of key terms and concepts are essential. For example, when describing data about the youth in an evaluation assessing a youth development program, the specific ages of the youth must be clearly defined since not all cultures define “youth” the same way.
Along with clear definitions of key terms, communicating results also requires making careful comparisons.

A percentage standing alone doesn’t mean very much. Describing results often involves a comparison like a comparison between youth that do and do not participate in programs. Comparisons should be carefully selected so that they add meaning to the results. Selecting careful comparisons means using appropriate information or data to appropriately illustrate results. Options for careful comparisons include outcomes of similar programs or evaluations, outcomes of the same program from other years, the goals of the program, and the participants’ goals for their involvement.
Interpretation
Data analysis and interpretation are two separate processes. Interpretation gives meaning to the numbers or to the data. Numbers or numerical data are limited:
- They must be interpreted in order to have meaning
- They do not perfectly describe what the world is like
- They can contain different degrees of error
As an example of how to interpret results, the table below contains the results of the analysis of program satisfaction for the Arizona Youth Program.
| Program Satisfaction | |||
|---|---|---|---|
| Frequency of Participation | High (Very Satisfied) | Medium (Satisfied) | Low (Not Very Satisfied) |
| Frequent (>8 hrs/week)(N=50) | 50% (N=25) | 30% (N=15) | 20% (N=10) |
| Minimal (<4 hrs/week)(N=50) | 20% (N=10) | 20% (N=10) | 60% (N=30) |
| All participants (N=100) | 35% (N=35) | 25% (N=25) | 40% (N=40) |
Below is an example of how one might summarize the context of the data and provide definitions of key terms.
The data shown in the table above come from a program satisfaction survey given to middle school youth in the Arizona Youth Program during their final week of participation. This 12-week program took place during the fall semester and provided after-school tutoring and civic engagement activities. Satisfaction was measured for all participants from their selections of one of three responses: 3 = I am very satisfied with the program, 2 = I am satisfied with the program, and 1 = I am not very satisfied with the program.
Having already provided the context for the data and defined the key terms, this data could be interpreted as follows:
- Of all participants in the program, 40% reported a low level of program satisfaction; however, 60% of those who reported a low level of program satisfaction also demonstrated minimal (four hours or less per week) program participation.
- Of all participants, 35% reported a high level of program satisfaction. The majority of students reporting a high level of participation also showed frequent (eight hours or more per week) program participation.
- Of all participants, 60% reported a high or medium level of satisfaction, and 40% reported a low level of satisfaction.
- Of students who participated in the program on a frequent basis (eight or more hours per week), 50% reported a high level of satisfaction with the program.
- Of students who participated in the program on a minimal basis (four or fewer hours per week), 60% reported a low level of satisfaction with the program.
Based on these multiple ways of presenting the data, the following questions might be appropriate:
- Why would more frequent participation be related to program satisfaction? Do people come more often because they enjoy the program?
- Do all students’ perceptions improve over time (when comparing their perceptions of satisfaction at the beginning and at the end of the program)?
- Do we know if these results were statistically significant?
- Do we know if the level of participation caused participants’ satisfaction levels to change?
Not all of these questions will be answerable based on the available data. When communicating the results of evaluation to others, it may be useful to keep these questions in mind so that the limits of the study can be addressed.
Judgment
Making claims about programs based on evaluation results is the next step. Making a claim based on the evaluation framework, review, analysis, and interpretation of results is a judgment. The results from the Arizona Youth Program may lead to several types of judgments, conclusions, or claims. An example claim is provided below.
The amount a student participates in the program may affect their satisfaction with the program.
Recommendations
Making recommendations is the fourth step in reviewing the data and allows for the presentation of results in a meaningful way. Recommendations can often be the most visible part of a report. Though they can lead to controversy, recommendations can bring the data and evaluation processes together in a useful and meaningful way.
Some evaluators believe that they should always offer recommendations while others believe that it is not a part of the evaluator role to make recommendations. Regardless, it is likely that, as someone familiar with a program, a researcher will be asked to make a recommendation based on the results of their evaluation and communication with stakeholders.
Qualities of a Good Recommendation
- Both useful and practical
- Supported by the data analysis
- Created in conjunction with the stakeholders
- Within the control of the program or stakeholders
- Open to multiple options
- Considerate of the costs and benefits to the program
- Deliberate
Example Recommendations Based on the Example Data
- Learn more about students who participate minimally. Investigate strategies that may increase their involvement.
- Investigate why those students who are frequent participants tend to be more satisfied with the program.
- Expand on the satisfaction survey findings by asking students to suggest additional activity ideas.